

UX KPIs and ROI
8 min read
User experience is essential for digital product development. An investment in UX brings both financial and brand-related benefits: development effort is reduced, and user-oriented products are created. Conversions and revenue are increased, and support volume is reduced. This can also be expressed in figures using ROI and KPIs. This makes the value of UX visible and tangible. Stakeholders can be convinced more easily.

The ROI of UX: why investing in user experience pays off
Better usable products:
Optimising the user experience doesn't just boost user satisfaction. Costs can also be reduced. Mozilla, for instance, managed to cut support calls by 90 percent through UX testing and the resulting product improvements (Nielsen Norman Group, 2015). Usability optimisations reduced user errors on an e-commerce site by 90 percent (Karat, 2005).Increasing conversions and revenue:
Investment in user experience pays off. A study by Oracle (2012) shows that 85 per cent of users would pay 25 per cent more for a positive customer experience. Through the targeted use of UX methods, Hanseatic Bank was able to increase the conversion rate of credit card applications by 107 per cent (m-pathy.com/de, 2016).Reducing development effort:
The time required for changes nearly doubles with every project phase. Early involvement of UX can reduce costly adjustments later on. UX methods simplify decision-making and help prioritise tasks for development. Unimportant features never even get developed. A study by Experience Dynamics (2014) shows that input from a UX designer can save developers 33 to 50 percent of working time.
ROI versus KPI: what the metrics reveal about user experience
ROI and KPIs show how successfully a company has achieved certain goals. ROI is a purely financial metric. To assess individual investments, a variant of ROI is often used today that shows return on UX measures relative to investment. For example, ratio of costs for optimising an order funnel to revenue growth from fewer drop-offs.
ROI of user experience is viewed on two levels: UX activities during ongoing operations create additional effort, which however pays off through improved metrics. In the development process, on the other hand, considering UX from the start brings savings, e.g. through efficient alignment and optimisation of a prototype, or targeted prioritisation of tasks.

KPIs (key performance indicators) are the central factors used to measure the effect of UX measures at different levels. They reflect business goals such as revenue growth, increasing user numbers or reducing support call volume. How UX measures affect KPIs is measured using UX metrics. UX KPIs and metrics are defined individually – based on the specific targets derived from a company's strategic and commercial goals.
UX metrics can be divided into behavioural and attitudinal, relating to the behaviour and the attitude of users respectively. The former are based on what users do in user tests or live on the website, attitudinal UX metrics are based on user statements. Together, they can paint a multi-layered picture of the quality of the user experience.

What measuring KPIs/metrics and UX ROI delivers
Measuring KPIs and calculating ROI is useful for several reasons. These metrics help embed UX within the organisation and raise UX maturity. They can also strengthen acceptance and understanding of UX more generally. Acceptance and understanding of UX can be strengthened overall. They enable an objective view of developments and prevent decisions being made on opinion alone.
The metrics serve stakeholder management. They help position UX topics and related strategic goals with decision-makers. Figures and facts prove how sensible and effective a UX team's measures are. That makes them good, effective arguments when allocating budget.
KPIs are useful for UX benchmarking. They can indicate the direction (further) development should take. The data also enables comparison with internal or external benchmarks.
Not least, KPIs can also act as an early warning system. By reducing the complexity of large data volumes, they act as a pulse check for digital offerings. This allows problems or deteriorations on a website or in a specific area to be identified and fixed early.
How to choose the right UX metrics
For KPIs to be effective and manageable, you should limit yourself to a few, well-suited ones. They must be aligned with the respective goals and plans. Metrics can relate to an entire digital offering or to individual areas and features.
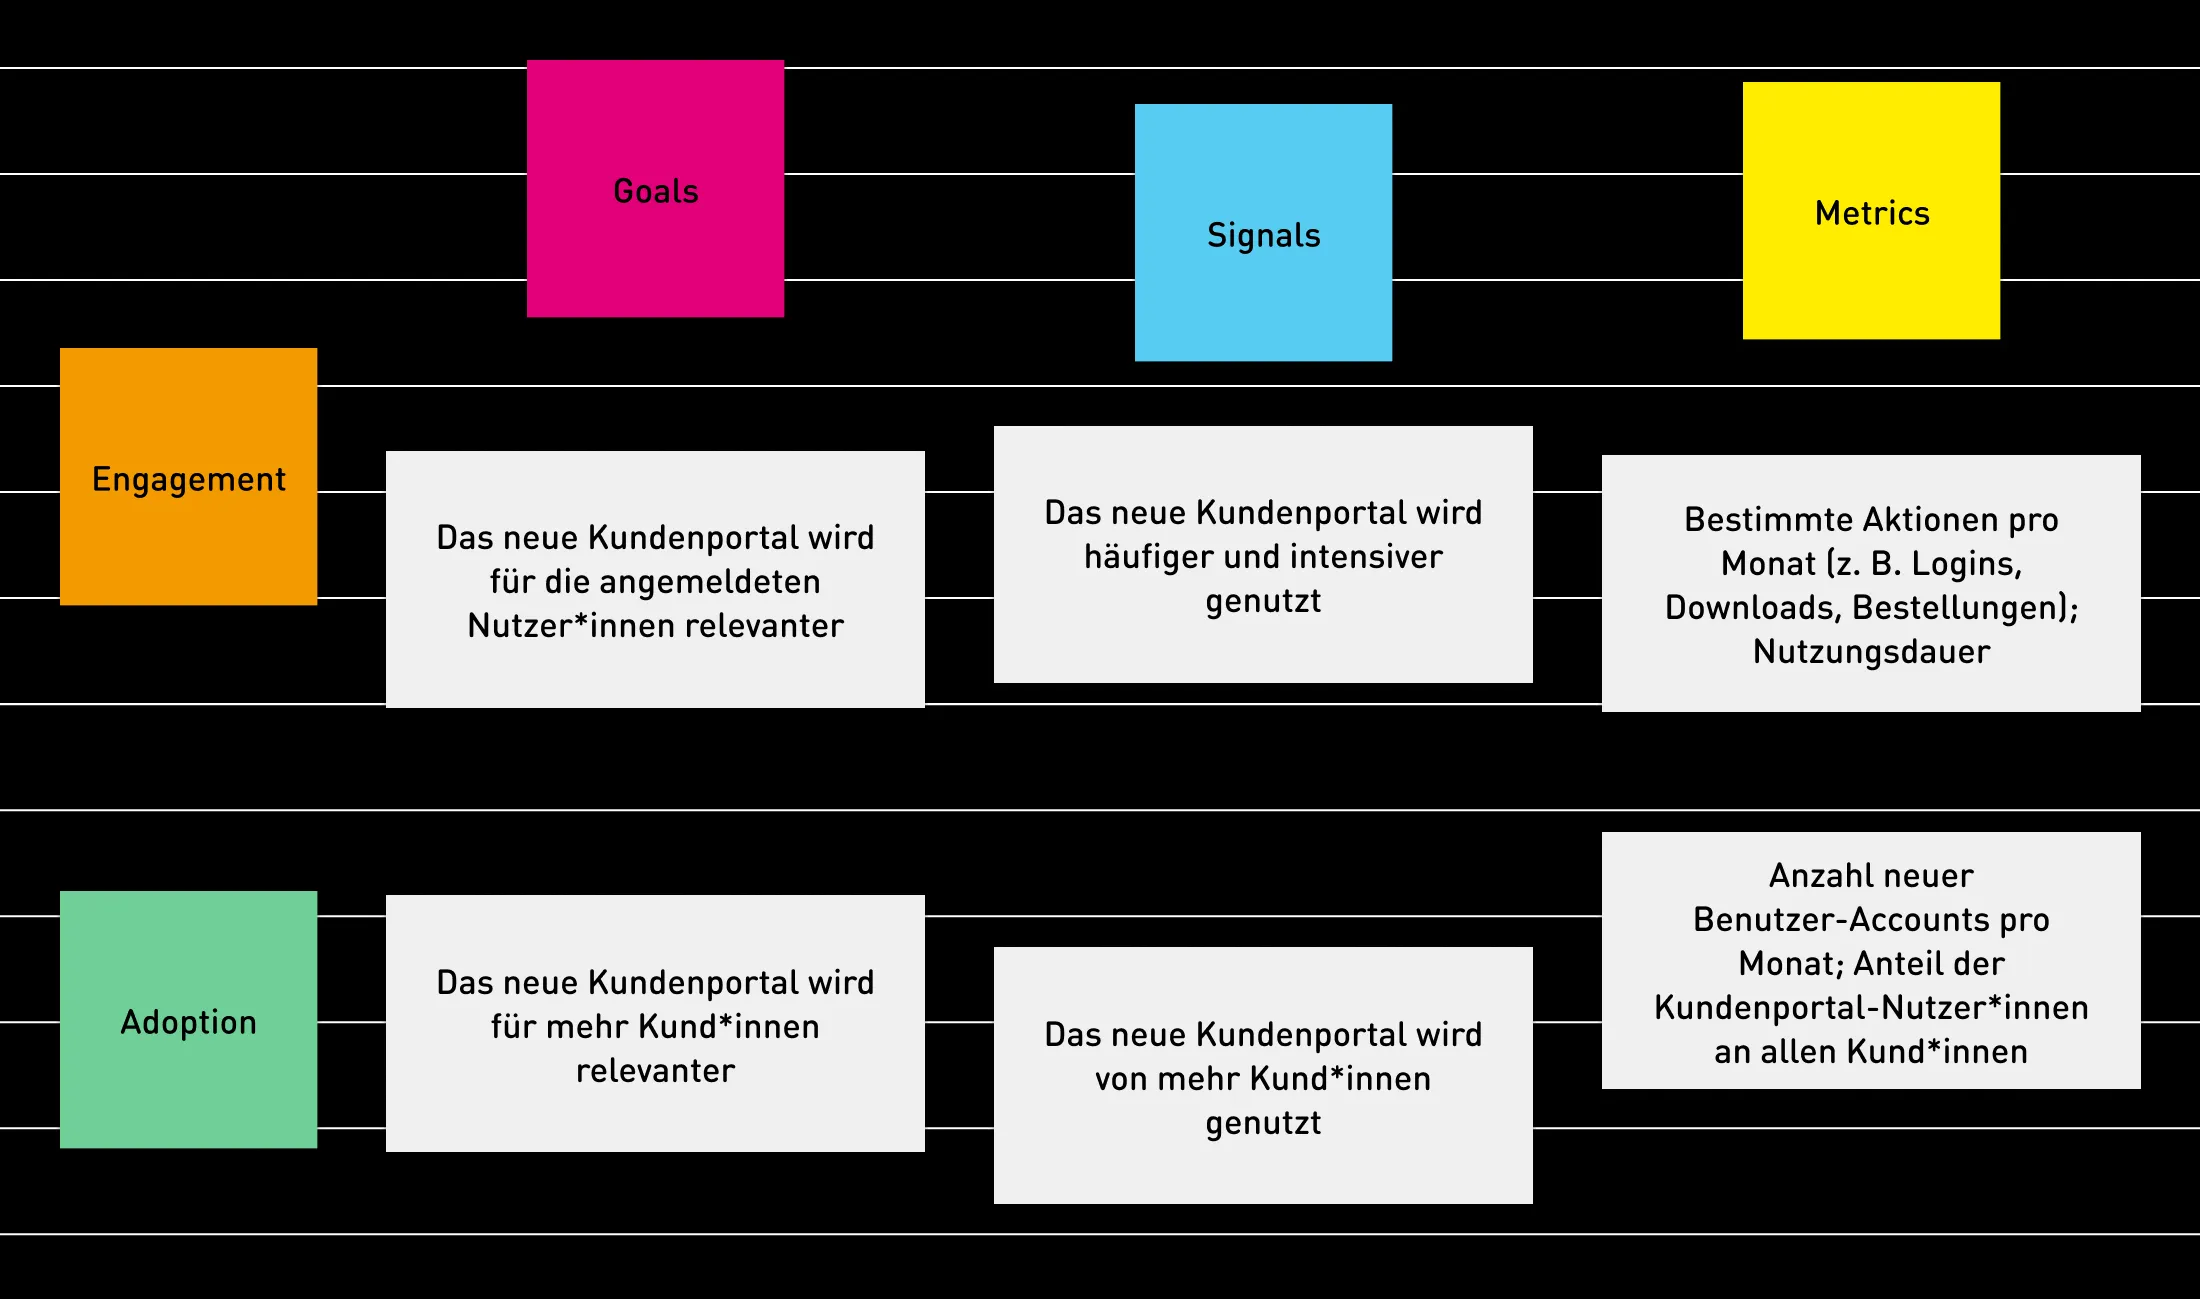
Google's HEART framework and the goals-signals-metrics process can help when choosing the right metrics. The framework describes the quality of user experience across the categories happiness, engagement, adoption, retention and task success. This helps decide which categories are useful for the intended evaluation and which aren't. In the goals-signals-metrics process, a product's goals are defined and the corresponding signals identified. Signals indicate whether and how well the defined goals are being achieved. Finally, the specific metrics that measure and track these signals are determined. In collaboration with Google Ventures, Telepathy put this approach together nicely based on an article by Kerry Rodden.
Behavioural UX metrics
Selected metrics and what they measure
Task Success Rate
Die Task Success Rate ist ein Indikator dafür, wie erfolgreich Nutzer*innen ihr Ziel erreichen. Sie misst den prozentualen Anteil korrekt erledigter Aufgaben. Sie ist nur messbar, wenn ein Ziel klar definiert werden kann wie z. B. das Ausfüllen eines Formulars.
Time on Task
Diese Metrik beschreibt, wie lange User*innen benötigen, um eine Aufgabe erfolgreich abzuschließen. Je kürzer die Bearbeitungsdauer ist, umso besser ist meist das Nutzungserlebnis.
User Error Rate
Die User Error Rate beziffert alle unbeabsichtigten Aktionen und Fehler, die Nutzer*innen bei einer Aufgabe machen. Der Score hilft bei der Identifizierung von Verständnis- und Usability-Problemen.
Conversion Rate
Die Conversion Rate gibt den Anteil der User*innen an, die eine definierte Aktion ausführen. Das ein Produktkauf sein, ein Download, eine Newsletter-Registrierung oder Kontaktaufnahme.
Ausstiegs- oder Absprungrate
Wer im Blick behält, wo Nutzer*innen aussteigen oder von einer Seite sofort wieder abspringen, kann frühzeitig reagieren. Denn diese Metriken sind hilfreiche Indikatoren, um Probleme an wichtigen Stellen innerhalb eines digitalen Angebots aufzudecken und zeitnah beheben zu können.
Attitudinal UX metrics
Frequently used questionnaires or indices
Net Promoter Score
Der NPS ist eine Maßzahl für die Weiterempfehlungs-bereitschaft bzw. die Loyalität der Kund*innen. Diese werden anhand ihrer Wahrscheinlichkeit ein digitales Angebot weiterzuempfehlen in Detraktoren (eher/ unwahrscheinlich), Indifferente und Promotoren (sehr wahrscheinlich) unterteilt. Der NPS drückt die Differenz von Promotoren und Detraktoren im Verhältnis zur Anzahl der Befragten aus.
System Usability Scale
Der SUS ist ein einfacher Fragebogen, mit dem Nutzer*innen die Usability eines digitalen Angebots bewerten. Der daraus berechnete SUS-Score reicht von 0 bis 100. Ein Angebot mit einer guten Usability sollte einen Wert von mindestens 68 erreichen. Bei einem niedrigeren Ergebnis sollten konkrete Usability-Probleme dringend identifiziert und Optimierungs-Maßnahmen ergriffen werden.
Customer Satisfaction
Die Kundenzufriedenheit ist maßgeblich für Erfolg und Wachstum von Unternehmen. Mit dem CSAT kann diese gemessen und vergleichbar gemacht werden. Anwender*innen bewerten auf einer 5er-Skala, wie zufrieden sie mit einem digitalen Angebot, Produkt, Service etc. sind. Der CSAT-Score zeigt den Anteil der zufriedenen Kund*innen an allen Befragten an.
Single Ease Question
Die SEQ misst die gefühlte Schwierigkeit. Diese wird häufig im Rahmen von Nutzertests abgefragt, kann aber auch live auf einer Website erhoben werden. Nutzer*innen bewerten auf einer Skala, wie einfach sie eine bestimmte Aufgabe fanden.
AttrakDiff
Mit dem AttrakDiff oder dem AttrakDiff mini werden Bedienung und Aussehen eines interaktiven Angebots von Nutzer*innen bewertet. Mit dem Messinstrument wird erhoben, wie „begehrenswert“ ein interaktives Angebot ist.
UX Questionnaire
Der Fragebogen erhebt ein umfassendes Bild der User Experience. User*innen bewerten dabei sowohl klassische Usability-Aspekte wie Effizienz und Steuerbarkeit, aber auch User Experience Aspekte wie Originalität und Stimulation.
Outlook: how the disciplines are moving closer together
Especially in companies with high UX maturity, disciplines such as user experience, customer experience, and also SEO and web analytics are converging further. Usage experiences on digital touchpoints must also be considered in the context of the overall customer experience. The interdependence of the disciplines is increasing. Close collaboration and lively exchange between departments will therefore become more important for business success in future. A sensibly designed tracking setup can be a helpful means of keeping regular exchange going.
The goals and metrics overlap, the disciplines learn from and benefit from one another. UX metrics also allow conclusions about the quality of the overall customer experience. Creating good user experiences has a positive effect on search engine rankings and the traffic that comes with it. By taking search intent into account – a clustering by which Google categorises search queries – the UX of landing pages can be improved. UX metrics and figures from web analytics can complement each other and provide explanatory approaches.
What can we do for you?
Would you like to realise a digital project? Then get in touch with us. As a reliable partner, we offer interactive brand experiences and complete digital solutions from a single source.
Your contact person
- Marcus Völkel
Consultingsynaigy
Show phone numberShow email address